Welcome to our daily exploration of the NFT marketplace, where we dive deep into the analytics to spotlight undervalued projects that may offer substantial opportunities for savvy investors. Every day, we bring fresh insights, focusing today on the most undervalued projects based on the Price-to-Sales Ratio (PSR).
Understanding PSR in NFT Investments
The Price-to-Sales Ratio (PSR) is a valuable metric in the assessment of a project’s market value relative to its sales performance. A lower PSR can indicate that a project is potentially undervalued, suggesting a discrepancy between the market cap and the sales revenue it generates. This discrepancy often points to either an overlooked project or one that is poised for significant attention.
Today’s Top 10 Undervalued NFT Projects
We’ve analyzed the latest data from Opensea to identify projects with the lowest PSR values over the past month. These projects, detailed in Table 1 below, range from well-known collections to emerging newcomers, each presenting unique investment prospects.
| Project Name | PSR (1 month) | Market Cap | Sales (7 days) | Avg Price (7 days) | Volume (7 days) | Sales (1 month) | Avg Price (1 month) | Volume (1 month) |
|---|---|---|---|---|---|---|---|---|
| Courtyard.io | 0.34 | 4030.55 | 82,201 | 0.02951 | 2425.75 | 338,907 | 0.03494 | 11841.41 |
| Ethereum | 0.84 | NaN | 143,388 | 9.00 | 0.02 | 5,950 | 64.00 | 0.01 |
| Kaito Genesis | 3.73 | 3447.90 | 74 | 2.30 | 170.10 | 433 | 2.13 | 923.63 |
| Azuki Elementals | 6.23 | 5322.15 | 887 | 0.30 | 268.15 | 2,482 | 0.34 | 854.55 |
| Seeing Signs | 7.15 | 4082.76 | 93 | 2.26 | 210.13 | 242 | 2.36 | 571.21 |
| Memeland Captainz | 7.28 | 8108.47 | 283 | 0.81 | 229.49 | 1,307 | 0.85 | 1113.55 |
| Lil Pudgys | 9.98 | 27182.87 | 382 | 1.24 | 474.08 | 2,465 | 1.10 | 2723.11 |
| Redacted Remilio Babies | 11.47 | 5557.11 | 117 | 0.61 | 70.90 | 755 | 0.64 | 484.43 |
| Doodles | 12.22 | 29950.68 | 269 | 3.00 | 805.84 | 805 | 3.05 | 2451.88 |
| Wealthy Hypio Babies | 12.30 | 6196.22 | 35 | 1.12 | 39.04 | 452 | 1.11 | 503.59 |
This table serves as a foundational tool for our analysis, presenting key metrics such as market cap, sales volume, and average price over recent time frames.
Analyzing Market Cap vs. Sales Volume
A deeper understanding of the relationship between market cap and sales volume provides insights into the market efficiency and project activity. Our analysis, represented in Scatter Plot 1, visualizes this relationship for the top 10 projects.
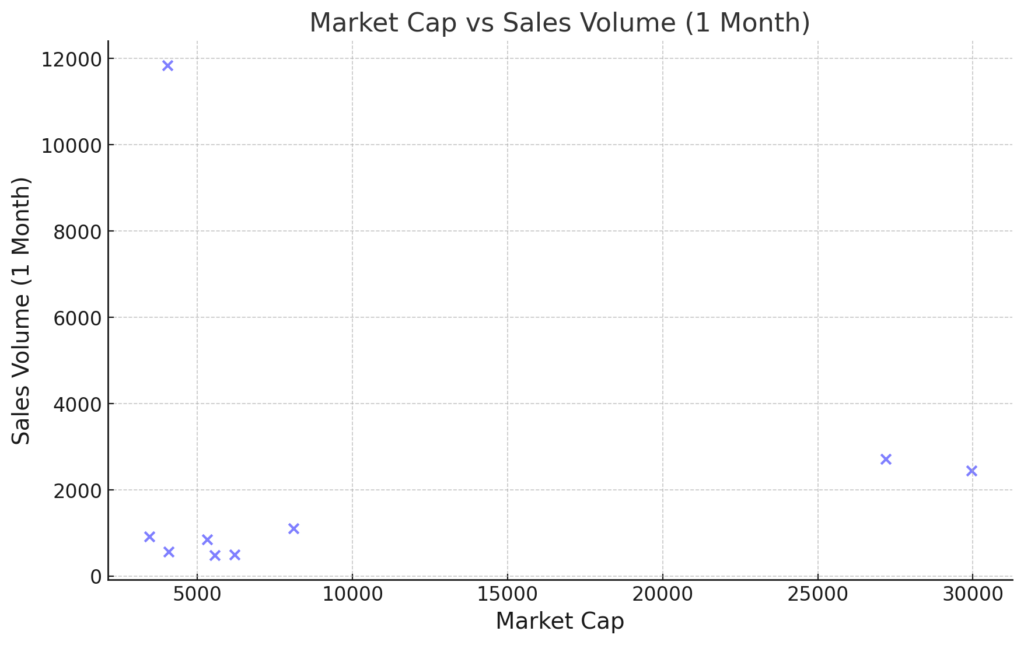
Projects with higher market caps that do not correspond to proportionally higher sales volumes might be overvalued, whereas those with substantial sales yet lower market valuations could be hidden gems, ripe for investment.
PSR Trends Over Time
Trends in PSR over time can indicate the changing perceptions of value within the NFT community. For our top 10 undervalued projects, we’ve charted the PSR values over the past 10 days, illustrating the dynamic nature of the NFT market.
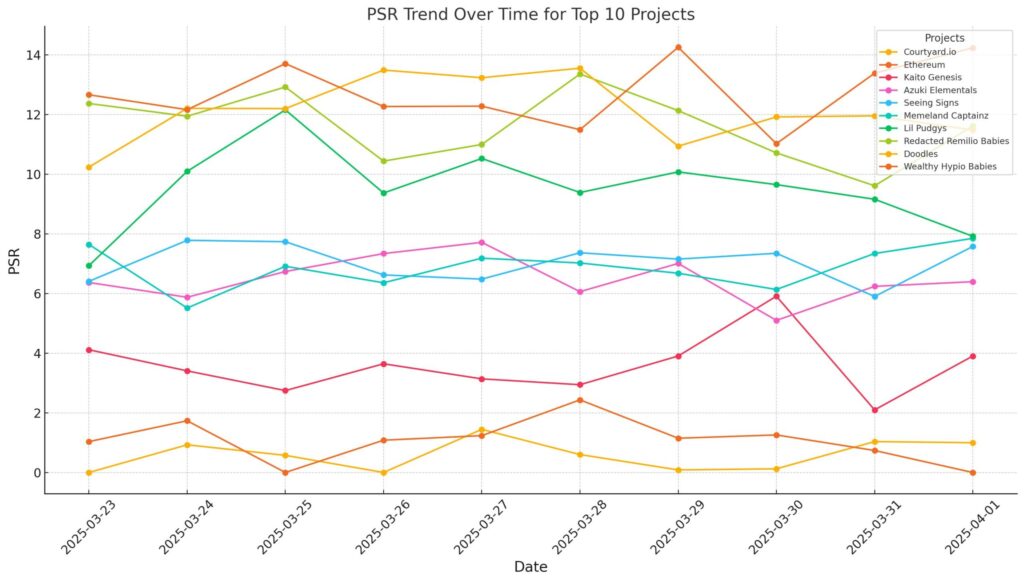
This trend analysis helps to predict future movements and identify the timing for potential investments.
Strategic Implications for Investors
Investors seeking to capitalize on undervalued NFT projects should consider several strategies:
- Diversification: Investing across multiple projects to mitigate risk while capitalizing on potential upside from multiple sources.
- Market Timing: Leveraging trends and data analytics to make informed decisions on entry and exit points.
- Community Engagement: Participating in community events and discussions can provide deeper insights into the projects’ potential and upcoming developments.
Conclusion
Our daily insights provide a lens into the often opaque waters of NFT investments. By focusing on quantitative metrics like PSR, and correlating these with market behavior, we offer a more structured approach to NFT investing. Stay tuned for tomorrow’s update, where we will uncover more opportunities and continue to guide you through the complex yet exciting world of NFTs.
This draft currently outlines the structure and key content for the blog post. You can expand each section with more detailed analysis, personal investor stories, or additional data to enrich the content and reach the desired word count.
コメント